Demonstration of Signal Extraction with SVD
Intro
Hello! This post is an introduction and demonstration of the singular value decomposition (SVD) and its use in pattern finding or feature extraction from data. My goal is to describe and show what it does without relying on a detailed mathematical background. Hopefully you’ll get something out of this even if you haven’t studied linear algebra before. All of the code used in this demo is available in Python on my Github.
Let’s get started!
So what is the SVD?
The SVD is a mathematical method that transforms a dataset into its most fundamental components. What that means is that if we have a dataset consisting of many noisy observations of a single signal, the SVD allows us to extract the clean signal. Furthermore, it will give us an indication that everything else is just noise so we have found the fundamental meaning of the data.
Mathematically, the SVD writes a rectangular matrix (\(m\times n\) array) in terms of orthogonal row- and column-basis vectors. These vectors are called singular vectors. The original data can be reconstructed as a weighted sum of rank-one matrices formed by the outer product of each pair of row- and column-basis vectors. The weights are called singular values.
The equation for SVD is
\[A=U\Sigma V^T\]where:
- \(A\) is an \(m\times n\) matrix
- \(U\) is an \(m\times n\) matrix with orthonormal columns
- \(\Sigma\) is a non-negative diagonal matrix sorted in non-increasing order with largest values in the top left
- \(V\) is an orthogonal matrix
For the sake of completeness, I should mention that the formulation I described assumes \(m\geq n\) and that the data are all real.
So the SVD decomposes the original data into pairs of patterns across the rows and columns of the original data and provides weights describing the contribution of these patterns to the overall dataset.
Wait, my data is a matrix??
Often times, yes it is. This structure arises from multiple measurements of a single system. For example, the measurement could be money in your bank account over time. This is a vector; for a single sample (you), there is one measurement for each timepoint. You can (in theory) get a matrix by collecting similar data from five of your friends. The data now has one column for each person and one row for each timepoint. Often times these data matrices are tall and narrow because we are able to make many measurements from each sample, but only are able to get a few samples.
How does the SVD extract fundamental features?
The key to success of the SVD is that the original data can always be written by at most \(\min(m,n)\) rank-one matrices. For simplicity, in the rest of this example I will focus on the case of a tall and narrow dataset, i.e., \(m>n\). Therefore, at the very most, \(m\) (the number of samples) patterns and weights are needed to reconstruct the exact data. It is possible that the collected data is redundant, in which case less than \(m\) patterns are necessary to capture the entire dataset. This is generally not the case in real life applications because of measurement noise, but is often true if the noise were filtered out. Consider the case described above where the data consist of many noisy measurements of a single signal. The signal is prominent in the data because it is observed in every sample. However, the noise is random and provides no consistent contribution to each measurement. This is captured by the singular values; the first (largest) singular value (and corresponding singular vectors) always contains the most information about the dataset. In this example, the SVD will return a single pattern with a large weight (singular value) and many other patterns that capture the noise, but each with a small weight. This disparity in weights allows us to interpret that only one important thing is happening in the data and the rest is noise.
Let’s see the SVD in action!
I’ll demonstrate everything we just discussed on synthetic data. The goal is to build a mock dataset with some known signal and use SVD to uncover that signal. I’ll step through a number of examples to show how SVD behaves in each case and how the results can be interpreted. I’ll show the following cases:
- Multiple observations of a single, clean signal.
- Multiple observations of a single, noisy signal.
- Multiple observations of related signals or a signal that evolves in time.
- Multiple observations of multiple noisy signals that evolve in time.
I will focus on additive noise, which describes the case where multiple non-interacting signals and noise sources are all part of the measured signal. This is the natural setting to apply SVD since the decomposition separates data into linear combinations of patterns.
Single, clean signal
I’ll start by creating a dataset that is simply many observations of the same sine function.
signal = np.sin(np.array(range(0, 360, 5)) * np.pi / 180.)
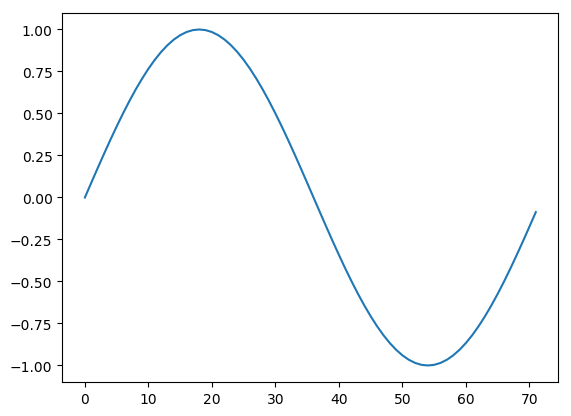
If we were to measure that signal 20 times, we would have a matrix of 20 columns, each containing the same signal across the rows. Notice that the matrix is made from just one pattern that, therefore, captures all of the information in the dataset. Mathematically, this is a rank-one matrix. We can find this using the SVD by extracting the pattern that we built the matrix from and showing that it captures all of the information. We can generate the data matrix and perform an SVD with the following:
data = np.transpose(np.array([signal for i in range(20)]))
u, s, v = np.linalg.svd(data)
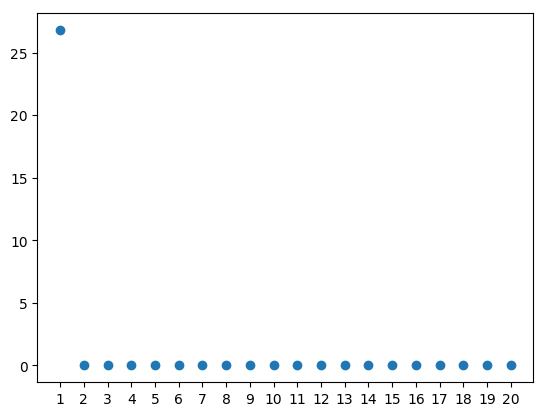
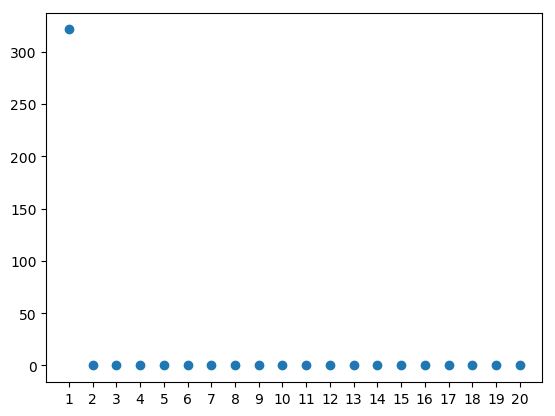
Let’s first have a look at the singular values, which tell us what singular vectors are interesting to look at. Plotting the 20 diagonal values of \(\Sigma\) (or s in the code above) shows that only the first pattern has any contribution to the dataset since it is the only non-zero entry.
Now that we know that there is only one pattern worth looking at, we can plot it.
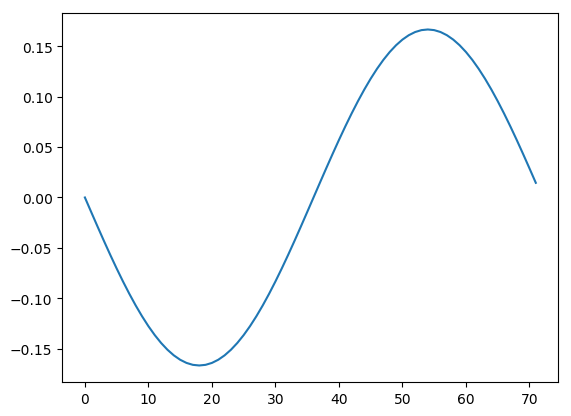
Great, it’s a sine wave! But wait, it’s upside down! How could this happen? This is a result of the uniqueness properties of the SVD. We can never know if each pair of patterns should be multiplied by a negative sign. However, we typically are in one of two situations. Either the sign is unimportant (e.g., in this data knowing that the signal is periodic might be enough) or we can figure out the sign using outside knowledge.
Now there’s a point to illustrate. We said based on the singular values that the first pattern is the only one that contributes to the data. But we know that \(U\) has the same shape as the data \(A\). Let’s take a look at the second pattern just to be sure it isn’t holding the all the secrets of the universe.
Indeed, this and all other columns of \(U\) are uninformative patterns that are created to fulfill the requirement that \(U\) has orthonormal columns.
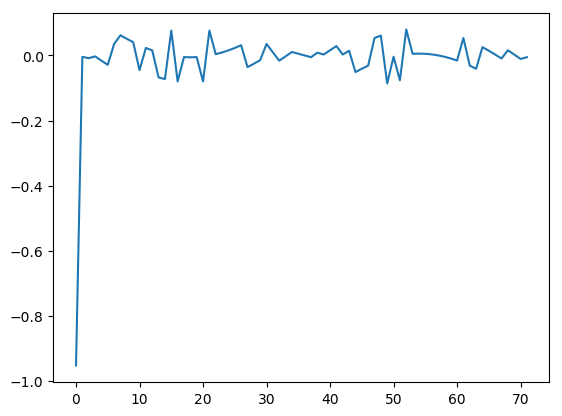
So far we’ve only looked at the left basis vectors, or patterns across the rows. What about the patterns across columns? Again, we only care about the first one (remember, left and right basis vectors always come in pairs). Knowing that all columns of the original dataset are the same, we can expect this pattern to simply be constant.
So the SVD told us that there is only one important pair of patterns in the data, a sine wave across the rows and a constant function across the columns. But that was an easy example. Let’s try to give it a bit of a challenge by adding random noise to the data and see how the SVD can separate consistent signal from noise that varies between samples.
Single, Noisy Signal
I’ll generate a matrix of random data with mean zero and standard deviation 0.1 to add to the data.
mu = 0
sigma = 0.1
noise = np.random.normal(mu, sigma, data.shape)
data_noisy = data + noise
Let’s plot the first two columns of the new noisy data matrix to get an idea of how this noise looks.
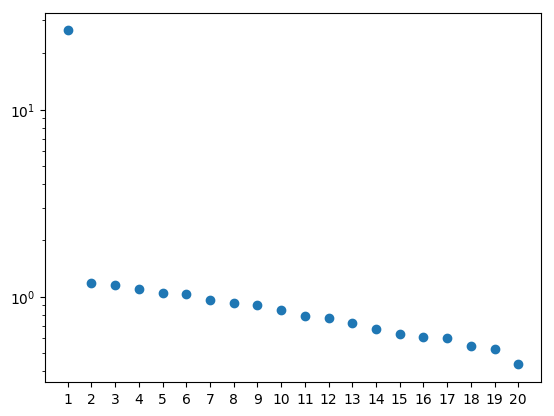
The SVD reveals that most of the data is captured by the first singular value. However, the other values are no longer zero because they are necessary to capture the noise. I’m plotting the singular values here on a log scale to make this more visible.
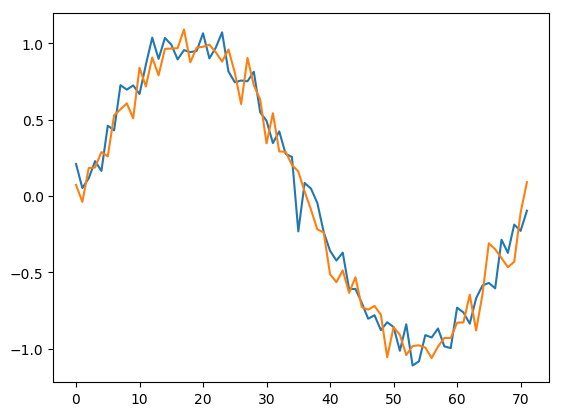
Looking at the first left-basis vector, we see how well the SVD was able to extract the underlying signal from noise. The result would improve with more than 20 samples (columns), but the signal has definitely been cleaned compared with the noisy data we saw above.

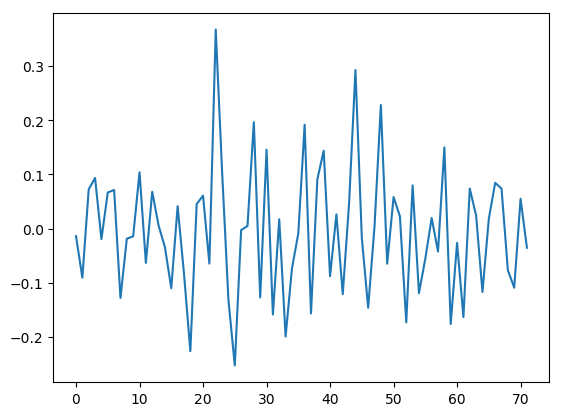
The remaining patterns capture the noise, as shown in the second pattern below.
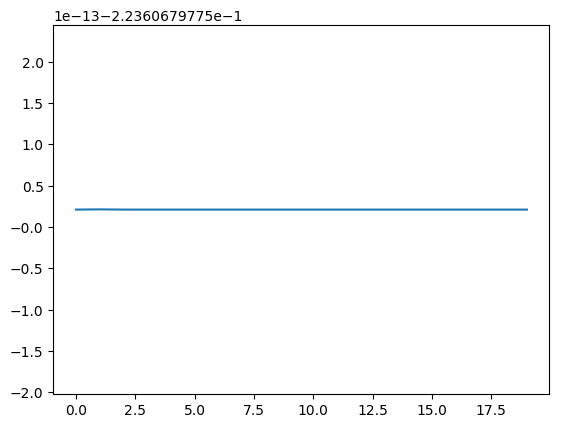
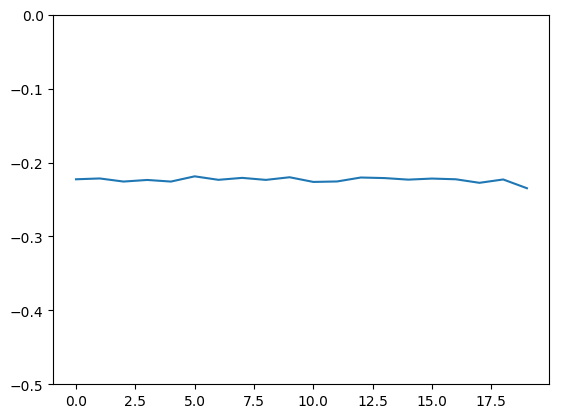
Looking now at the first pattern across the rows, we see that it is essentially flat as expected, but with a little noise added.
Dynamic, clean signal
So far we’ve seen only a single signal with or without noise added. But what if this signal changes over time? There are several ways that this could look.
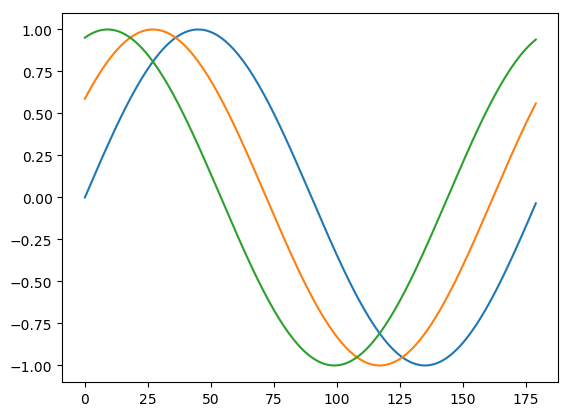
The first thing I’ll show is when columns of the data are pair-wise orthogonal. In this case the data cannot be simplified by the SVD and all patterns are equally necessary to describe the data. As an example, I’ll consider the case of phase-shifted sine waves for the columns. The first three columns are pictured below.
data_shifted = np.transpose([np.sin((n*np.pi/20) +
               (np.array(range(0, 360, 2))*np.pi/180.)) for n in range(0, 21)])
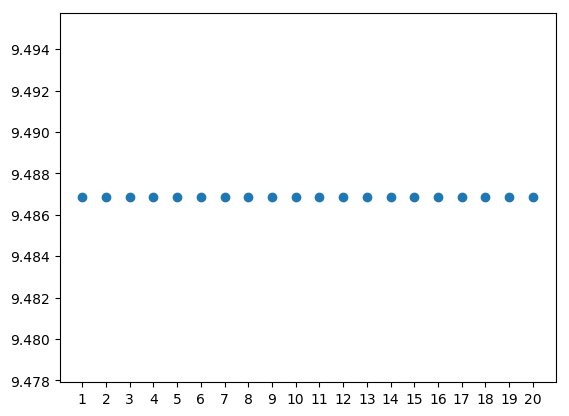
The singular values are all equal, indicating that each pattern is equally important.
The patterns in this case become a jumbled mess because it is degenerate. The uniqueness properties of the SVD only hold when the singular values are distinct. When singular values are identical, any vectors that span the space can be used for basis vectors. The SVD, therefore, is not very useful in this case.
However, something different happens if the original signal is simply amplified in each sample rather than phase shifted. To simulate this, I’ll just add a scaling constant to each column.
data_scaled = np.transpose([n * signal for n in range(1, 21)])
The singular values indicate that only the first pair of patterns are informative.
The pattern across the rows is still the same sinusoid that we expect.

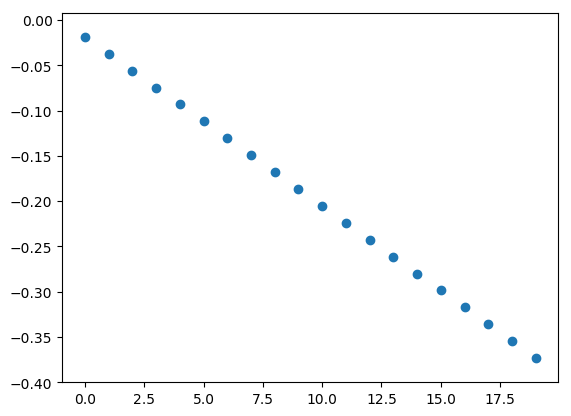
And the different scalings are captured by the corresponding pattern across the columns. Notice here that both the pattern across the rows and the corresponding pattern across the columns are flipped. This always happens in pairs, so you can use outside knowledge on either dimension to determine the correct sign.
Multiple, noisy dynamic signals
Putting everything together, I’ll demonstrate how the SVD can extract multiple signals from noise, each with their own time course. The first signal is a sine wave with exponential decay over time. This sort of thing arises from damped oscillations. The data are generated as an outer product of our sine signal with a decaying exponential. The second dataset is a quadratic signal that increases linearly over time. Finally, I add the same random noise matrix we used above. I set the data all to similar scales so the results are easier to see. It doesn’t necessarily have to be like that, but it helps.
# Generate first time course
time_signal = np.exp([-x for x in range(20)])
# Create first dynamic dataset
data_dynamic = np.outer(signal, time_signal)
# Generate quadratic signal
signal_2 = [((x-180)/10)**2 for x in range(0, 360, 5)]
signal_2 = signal_2/np.max(signal_2)
# Generate linearly increasing time course
time_signal_2 = [x/20 for x in range(1, 21)]
# Create second dynamic dataset
data_dynamic_2 = np.outer(signal_2, time_signal_2)
# Sum the two datasets and noise
complicated_data = data_dynamic + data_dynamic_2 + noise
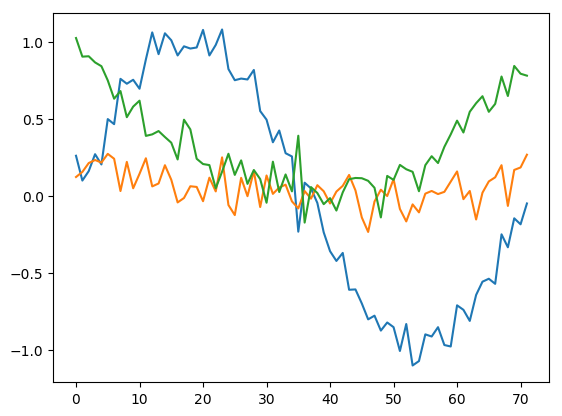
The data are now fairly complex. Let’s have a look at the first (blue), fourth (orange), and last (green) columns.
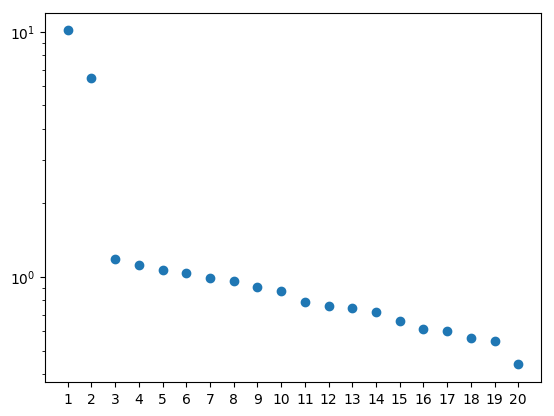
The singular values show us that the first two pairs of patterns are informative. The noise is captured in other patterns, but they have much lower singular values.
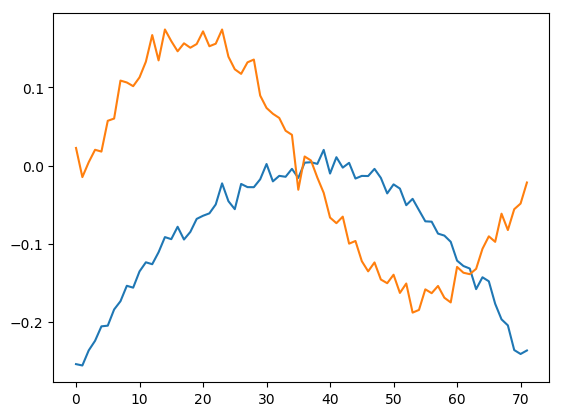
The first two patterns across the rows capture our sine wave and quadratic functions. With only 20 samples these patterns are rather noisy, but the shape of the signal is easy to recognize.
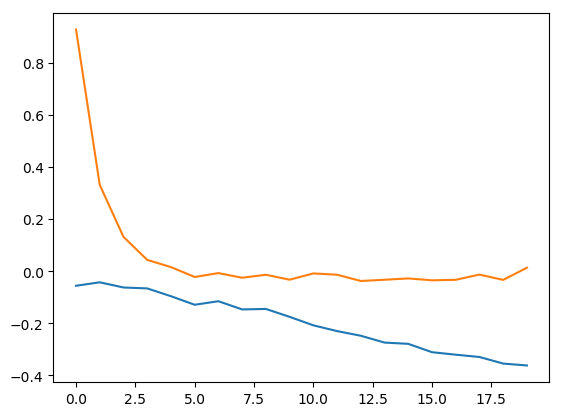
And the first two patterns across the columns capture the respective time courses for each signal.
Conclusion
We have seen how the SVD can be used to separate signals from additive noise and other signals. There is plenty more to explore than I covered here, so feel free to download my code and experiment with it. Hope you found this demonstration helpful. Please contact me if you have any questions or comments.